One of the motivations for developing WLJS platform is to enable the sharing of computable data in a self-descriptive format, allowing it to be viewed with no software installation required on any PC, Mac, smartphone, tablet, or other devices.
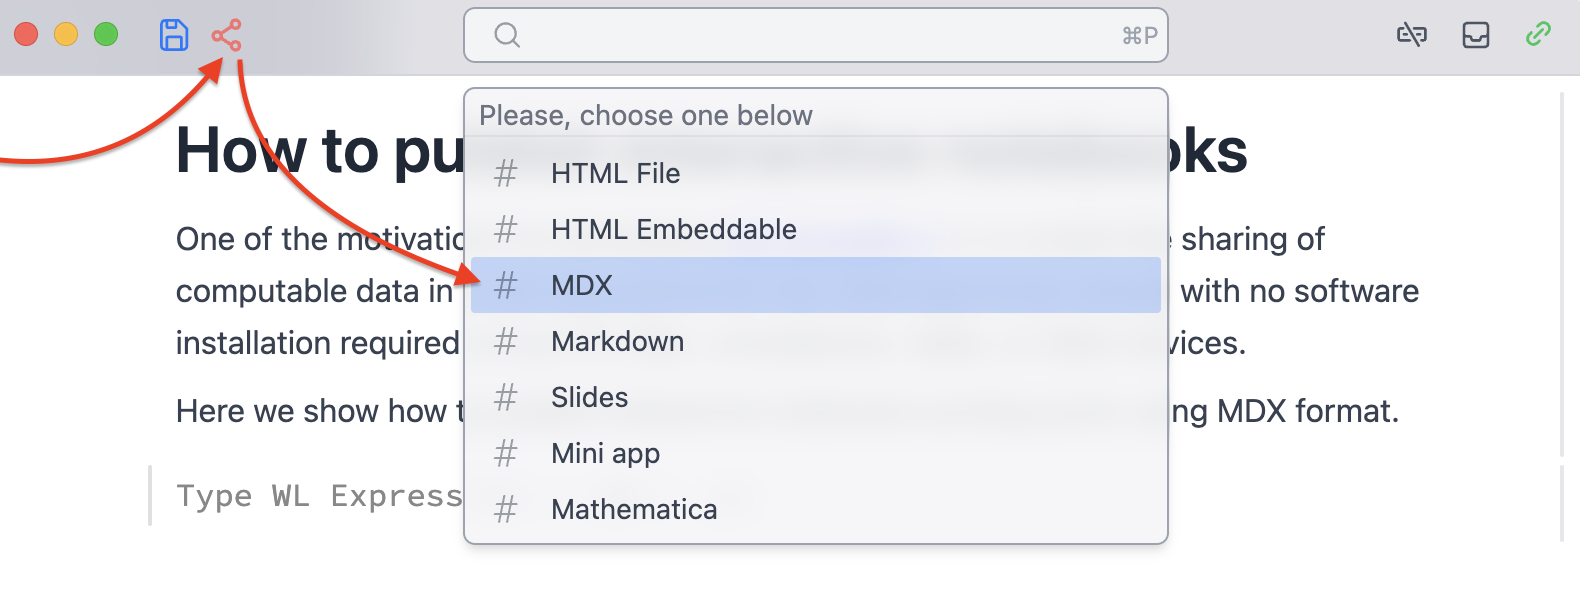
Here we show how to publish interactive notebooks as blog posts using MDX format:
 %3Cbr%20%2F%3E
Then you choose /contents/posts/youPost/index.mdx
The exported data is still editable and human-readable, since we rely on a native web-components:
## Features
Let's go briefly though what can be automatically exported

__Basic plots__

<wljs-editor display="codemirror" type="Input"  >{`Plot[1/x, {x,0,1}]`}</wljs-editor>
...
Features
Let's go briefly though what can be automatically exported
Basic plots
Plot[(*FB[*)((1)(*,*)/(*,*)(x))(*]FB*), {x,0,1}]
(*VB[*)(FrontEndRef["4aec892f-4d60-4487-873c-13601449ddd6"])(*,*)(*"1:eJxTTMoPSmNkYGAoZgESHvk5KRCeEJBwK8rPK3HNS3GtSE0uLUlMykkNVgEKmySmJltYGqXpmqSYGeiamFiY61qYGyfrGhqbGRiamFimpKSYAQB+MxUh"*)(*]VB*)
BarChart[{{1, 2, 3}, {1, 3, 2}, {5, 2}},
ChartLegends -> {"a", "b", "c"}]
(*VB[*)(Legended[ToExpression[FrontEndRef["9a346519-d51b-4c80-8925-55298a738d1f"], InputForm], Placed[SwatchLegend[{Directive[EdgeForm[Directive[Thickness[Small], Opacity[0.644], GrayLevel[0]]], RGBColor[1., 0.78, 0.2]], Directive[EdgeForm[Directive[Thickness[Small], Opacity[0.644], GrayLevel[0]]], RGBColor[0.784, 0.4752, 0.2]], Directive[EdgeForm[Directive[Thickness[Small], Opacity[0.644], GrayLevel[0]]], RGBColor[0.49920000000000003, 0.5552, 0.8309304]]}, {"a", "b", "c"}, LegendMarkers -> {{None}, {Automatic, Automatic, Automatic}}, LabelStyle -> {{}, {}}, LegendLayout -> "Column"], After, Identity]])(*,*)(*"1:eJzVUztLHFEUHleND9bGIn3AQpAFd3WS3WrwsYoyRnEkEkhz584ZvXh3bjxzR51fIFhoJyTWYhr/hNpok38QES1imoSApkiT+4CYlWCtt/i45/2dwzkvQjEftzqOk/YoeMNgfRyoQCIFBh1K48MSJFElLmiXbgX1iCmbdoxbtK5XwQSKRNaTqL4BNJMk5BD0KXWNDA2/dMu1UuSWw9IwrQ6WqrWKW3LdSq1KXg1Vo3JsE7cpmM9UWKf+AIlmE54b7QJmYPk9UzDHCYUobtdyUUGwTiRdthytl47xWSpt3i4F4wyBSrYGlm+n6WEJJgQ2bMh/nLRqYZnRlQTSNNXlggbh3Br1WGbfE8pkjp9/BZf7e1feXdgkktyHNeBMCY6tYLqaHB0TXCA65v3w8Lb/3c7RzVcPP37Q79R7vJyni4WBzefXHn4/PR49ZF+eAufz1a3tq5/nHm4eLJ5VTi48LPR+evt795vXvCmBTkkMhgZp806aw7ArNkNwBTC9s5tNa/lXMp/XIoHmIobySCZFg0hGH5LuFdcn55MQeCBzDvcqOw9IzWmKf3vwSS4yGehrUnPKGokZ+0gsVWN6flMRJFKN/A/SIQ+k"*)(*]VB*)
Tip: This is not a picture. Try to zoom or pan*
Contour and parameteric plots
ParametricPlot[
With[{z = u + I v},
{Re[z + (*FB[*)((1)(*,*)/(*,*)(z))(*]FB*)], Im[z + (*FB[*)((1)(*,*)/(*,*)(z))(*]FB*)]}
]
,
{u, -(*FB[*)((1)(*,*)/(*,*)(2))(*]FB*), (*FB[*)((1)(*,*)/(*,*)(2))(*]FB*)}
,
{v, -(*FB[*)((1)(*,*)/(*,*)(2))(*]FB*), (*FB[*)((1)(*,*)/(*,*)(2))(*]FB*)}
,
PlotRange -> 5
,
Mesh -> Automatic
]
(*VB[*)(FrontEndRef["abde8398-d769-4b5e-b9ab-e0e28564f0ff"])(*,*)(*"1:eJxTTMoPSmNkYGAoZgESHvk5KRCeEJBwK8rPK3HNS3GtSE0uLUlMykkNVgEKJyalpFoYW1roppibWeqaJJmm6iZZJibpphqkGlmYmpmkGaSlAQCRjRZI"*)(*]VB*)
Stream plots
StreamPlot[{-1 - (*SpB[*)Power[x(*|*),(*|*)2](*]SpB*) + y, 1 + x - (*SpB[*)Power[y(*|*),(*|*)2](*]SpB*)}, {x, -3, 3}, {y, -3, 3}, StreamScale->Large]
(*VB[*)(FrontEndRef["c13684f4-f310-43c8-a0ca-fdde17e05ae8"])(*,*)(*"1:eJxTTMoPSmNkYGAoZgESHvk5KRCeEJBwK8rPK3HNS3GtSE0uLUlMykkNVgEKJxsam1mYpJnophkbGuiaGCdb6CYaJCfqpqWkpBqapxqYJqZaAACCVBX6"*)(*]VB*)
Any 3D graphics
Plot3D[Sin[(*SqB[*)Sqrt[(*SpB[*)Power[x(*|*),(*|*)2](*]SpB*)+(*SpB[*)Power[y(*|*),(*|*)2](*]SpB*)](*]SqB*)], {x, -6, 6}, {y, -6, 6}, PlotRange -> All, Mesh -> None, ColorFunction -> "Rainbow"]
(*VB[*)(FrontEndRef["00658a08-b0c2-42df-9583-24ac84e82d55"])(*,*)(*"1:eJxTTMoPSmNkYGAoZgESHvk5KRCeEJBwK8rPK3HNS3GtSE0uLUlMykkNVgEKGxiYmVokGljoJhkkG+maGKWk6VqaWhjrGpkkJluYpFoYpZiaAgB2chUS"*)(*]VB*)
Manipulate
Manipulate[Plot[1.0 + Sin[w] Sin[x + w],{x,0,5Pi}, Epilog->{
Red, PointSize[0.1], Point[{8.0, 1.0 + Sin[w] Sin[8.0 + w]}]
}], {w,0,Pi}, ContinuousAction->True]
(*VB[*)(FrontEndRef["f05602eb-2a57-47d2-a92a-8431b7d5ef1b"])(*,*)(*"1:eJxTTMoPSmNkYGAoZgESHvk5KRCeEJBwK8rPK3HNS3GtSE0uLUlMykkNVgEKpxmYmhkYpSbpGiWamuuamKcY6SZaGiXqWpgYGyaZp5imphkmAQB+1BWa"*)(*]VB*)
Many more
Slides of your presentation, equations, mermaid diagrams, code insets, anything which is displable in WLJS Notebook application can be viewed on this page too!